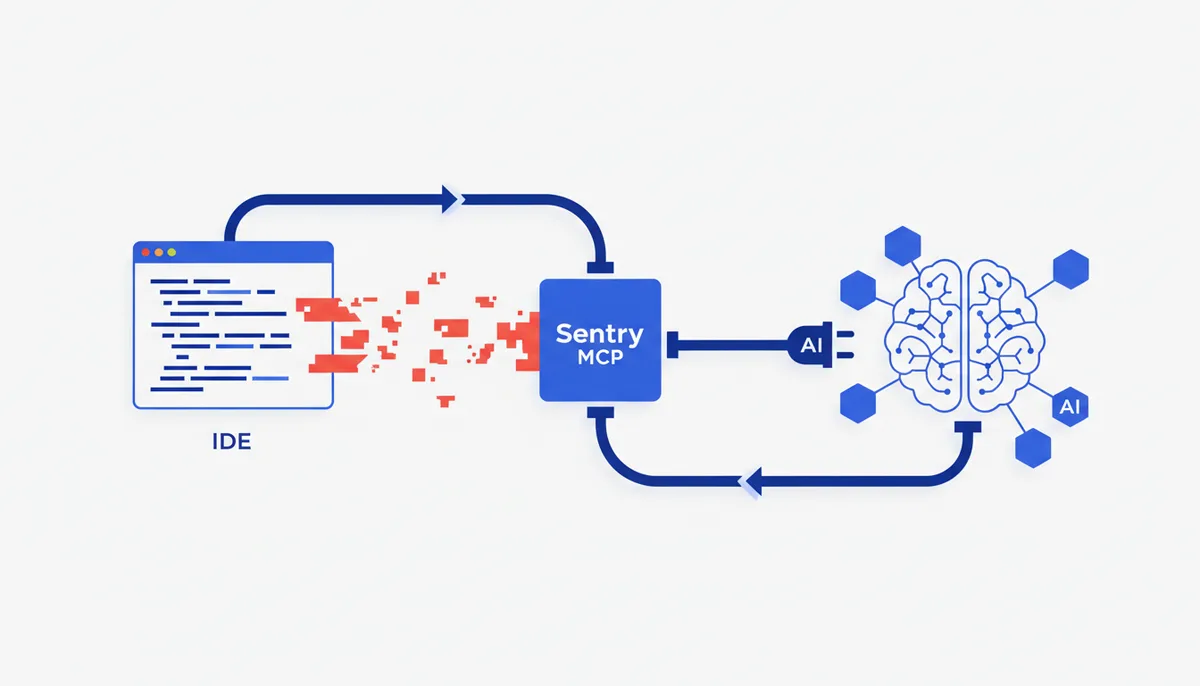
What it gives the AI
The AI gets the context of real production errors from Sentry: the issue list, stack traces, frequency, affected releases and performance traces. You can ask right in your IDE "what broke in prod and why" — and the AI proposes a fix based on the actual error rather than a guess. There's also the Seer AI agent for automated root-cause analysis.
Example: "Look into the most frequent error from the last 24 hours" — the AI takes the top issue by frequency, reads the stack trace and points at the line and the cause with a suggested patch.
Setup (exact steps)
The official hosted remote server with OAuth — no manual tokens needed.
Claude Code
claude mcp add --transport http sentry https://mcp.sentry.dev/mcp
Then /mcp → sign in to your Sentry account in the browser.
Cursor / Claude Desktop
{
  "mcpServers": {
    "sentry": {
      "type": "http",
      "url": "https://mcp.sentry.dev/mcp"
    }
  }
}
Usage example
Say: "Show me the stack trace for error ID abc123 and suggest a fix" → the AI pulls the issue details from Sentry, works through the trace and proposes a patch. Or "which release introduced these new errors?" — it correlates errors with deploys.
Security
- OAuth, least privilege: access is granted by signing in to Sentry; the AI reads errors and traces — a diagnostic, essentially read-oriented scenario (human-in-the-loop).
- Organization/project scope: limit the scope on the Sentry side so the AI only sees the projects it should.
- Revoking access: any time via
/mcp→ "Clear authentication".
Gotchas
- This is an external hosted service (
mcp.sentry.dev): for a closed perimeter or self-hosted Sentry, check for a separate connection option. - Stack traces and issue lists are bulky and run into the MCP output limit — ask about one specific error, not "everything from the past month".
- Error data can contain PII from request context — keep that in mind before running it through an AI.